Leveraging ESP32 Built-in JTAG for Advanced Debugging: A Step-by-Step Guide
Here's a step-by-step description of debugging using the ESP32 built-in JTAG:
Overview
The ESP32 microcontroller comes with a built-in JTAG interface, which allows for advanced debugging capabilities such as setting breakpoints, stepping through code, and monitoring variable values. This is essential for developers who need to diagnose and fix issues in their firmware or applications running on the ESP32.
Prerequisites
Hardware Setup: Ensure you have an ESP32 development board with JTAG pins available for connection. Most ESP32 boards have an integrated USB-JTAG adapter.
Software Tools:
- Zadig: This tool is used to manage and install USB drivers necessary for JTAG communication.
- JTAG Debugger: An IDE or debugging tool that supports JTAG, such as Visual Studio Code with the PlatformIO extension or Eclipse with the ESP-IDF plugin.
Steps for Setup and Debugging
Driver Installation with Zadig:
- Download and install Zadig from Zadig's website.
- Open Zadig and select
Options -> List All Devicesto display all connected USB devices. 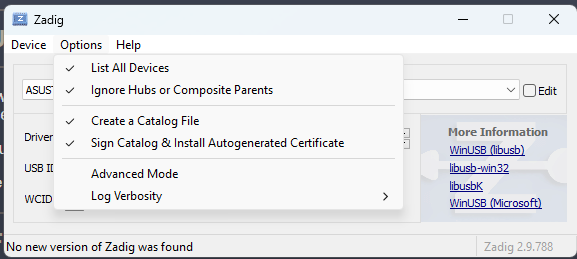
- Identify the two USB JTAG interfaces:
- Interface 0: This should be set to
USB Serial (CDC)for serial communication. Downgrade or install the driver if needed, ensuring it displays version 1.0. 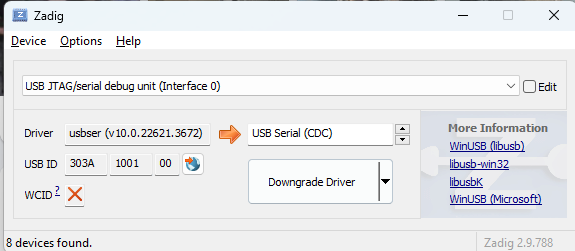
- Interface 2: Set this to
WinUSB (v6.1). If the version does not change, use the replace option to ensure the correct driver is installed. 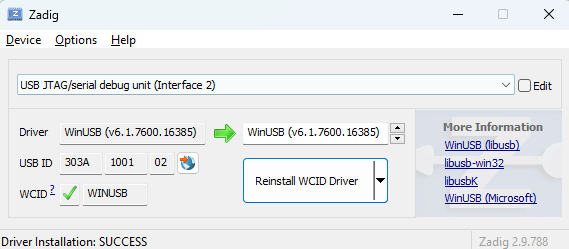
- Interface 0: This should be set to
Verify in Device Manager:
- Open the Device Manager on your PC.
- Confirm that the JTAG USB is recognized as
COM6or another available COM port.
Configuration in the IDE:
- Select USB Mode: Set to
Hardware CDC and JTAGin the IDE’s configuration settings. - JTAG Adapter: Choose
Integrated USB JTAGas the adapter type in your IDE or debugging tool. - Optimization: In the sketch or build settings, enable the
Optimization for debuggingoption to ensure the code is compiled with debugging information. 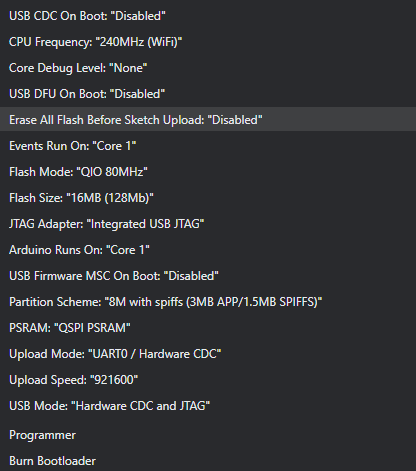
- Select USB Mode: Set to
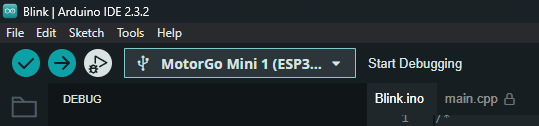
Debugging Process:
- Connect to the Target: Use your IDE to connect to the ESP32 via the JTAG interface.
- Set Breakpoints: Identify and set breakpoints in your code where you suspect issues or where you need to observe behavior.
- Step Through Code: Use the step-into, step-over, and step-out functions to navigate through your code and monitor execution flow.
- Inspect Variables: Monitor and inspect the values of variables and registers to diagnose and understand the current state of the application.
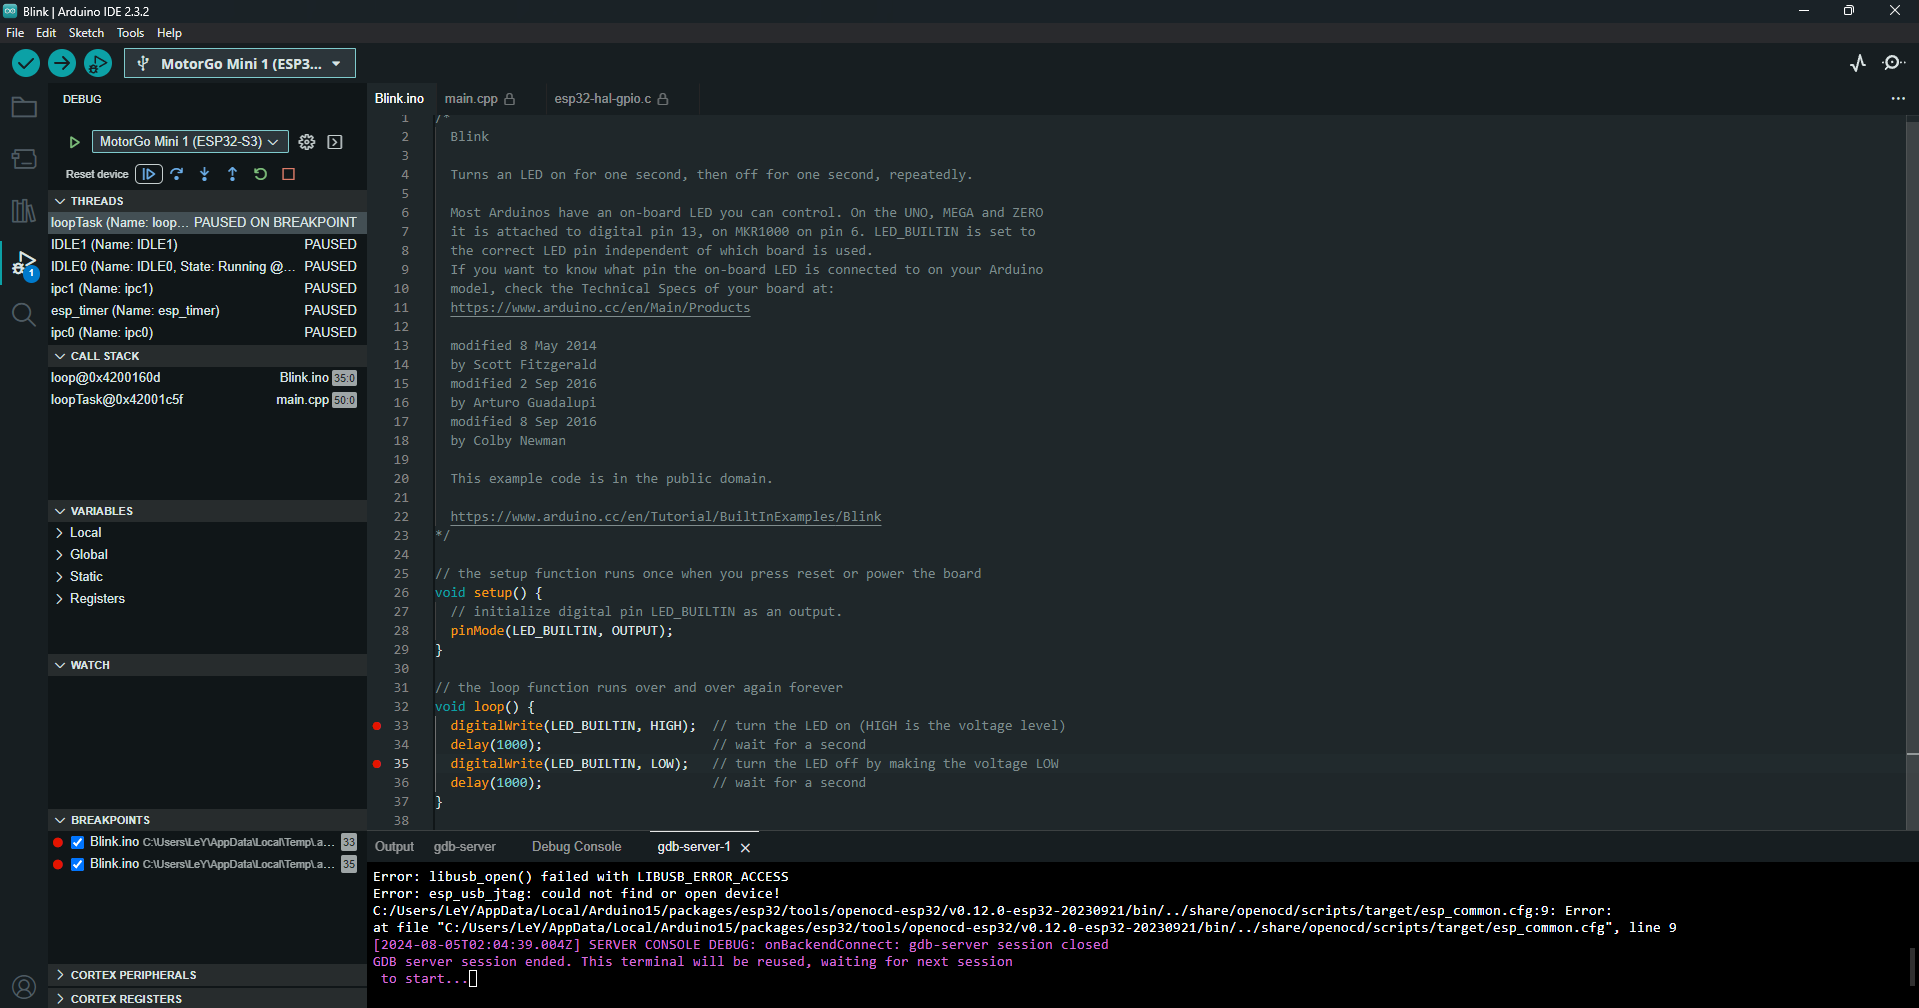
Troubleshooting:
- If the JTAG is not recognized, ensure that the drivers are correctly installed and that there are no conflicts in the Device Manager.
- Verify that the correct COM port is selected and that the JTAG interface is properly configured in your IDE.
Benefits of Using Built-in JTAG
- Real-Time Debugging: Allows for immediate insight into the program's behavior without the need to flash the firmware repeatedly.
- Improved Efficiency: Reduces the time spent on identifying and resolving issues.
- Enhanced Control: Provides greater control over the debugging process with capabilities such as pausing execution, inspecting memory, and more.
By using the built-in JTAG interface of the ESP32, developers can leverage powerful debugging tools to enhance their development workflow and ensure the reliability and performance of their applications.